

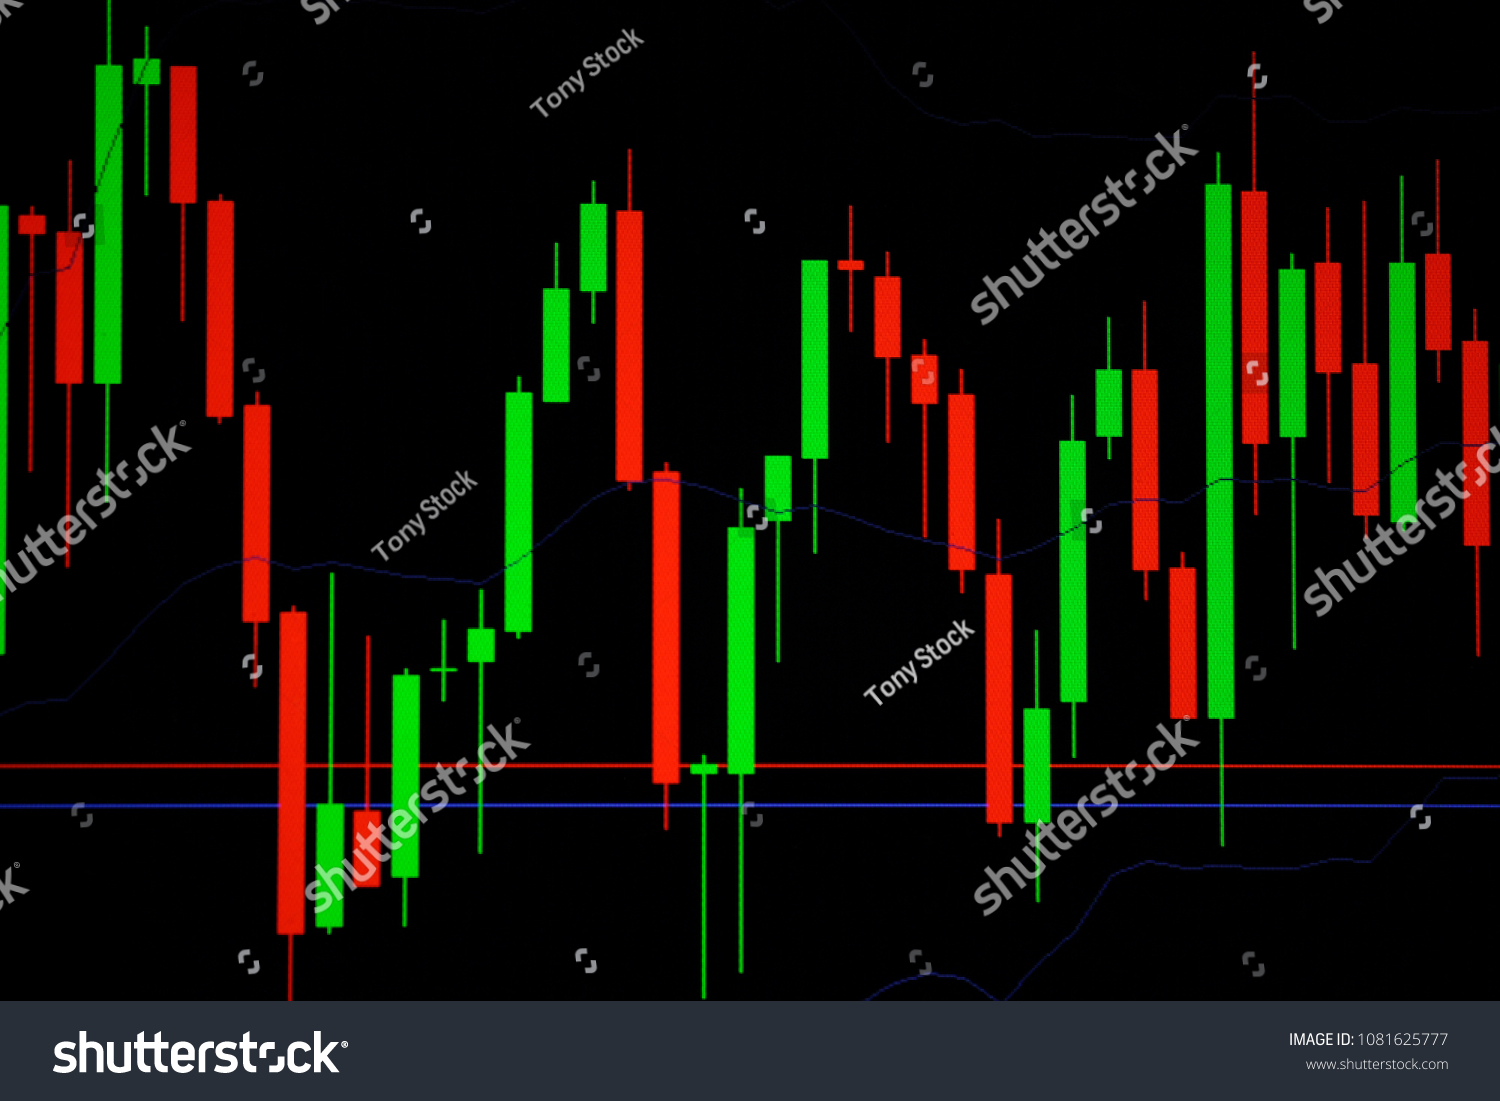
Candle stick graph chart with indicator showing bullish point or bearish point up trend or down trend of price of stock market or stock exchange trading investment and financial concept. thin focus.
ID: 1081625777
以图搜图
- 大图:5893 × 3928 像素·49.89 cm × 33.26 cm·300dpi·JPG
- 中图:1000 × 667 像素·35.28 cm × 23.53 cm·72dpi·JPG
- 小图:500 × 333 像素·17.64 cm × 11.75 cm·72dpi·JPG